Hockey Gods, Parlez Vous Francais?
Tonight the Montreal Canadiens will take on the Carolina Hurricanes in game one of the Eastern Conference Final after barely surviving game seven in each of their first two series. Montreal, despite being outshot 29-9 and going nearly 27 minutes without registering a shot on goal, defeated Tampa Bay courtesy of Alex Newhook's goal at 11:07 of the 3rd period. They were outplayed by the Buffalo Sabres in their next game seven, albeit not as dramatically, yet won again courtesy of another timely Newhook goal. Does Montreal deserve to be playing in the ECF? Of course they do! Luck and randomness are part of hockey, and so far Montreal has had the Hockey Gods on their side. Can Montreal endure another two game sevens the same way to reclaim the Stanley Cup for Canada for the first time since 1993 when they last won it all? Statistics suggest it is possible but unlikely.
Quantifying the Hockey Gods
Success in any pursuit, whether it be winning the Stanley Cup, or scoring a perfect 1600 on the SATs, or winning the lottery, requires a certain degree of skill and a certain degree of luck. The statistical framework called True Score Theory provides a model for quantifying just how much luck vs. how much skill may be involved in any of these endeavors. One would intuitively think that it takes more skill than luck to score a perfect 1600 on the SATs. Likewise, one would think that winning the lottery is inherently lucky because even a child possesses enough skill to come up with a set of Powerball numbers. Consider the following formula:
variance(observed outcome) = variance(skill) + variance(luck)
We can easily estimate the variance of luck and calculate the variance of the observed outcome using the NHL standings after a full 82-game season. Knowing these two terms of the equation allows us to solve for the estimated variance of skill. Consider the probability of winning a hockey game after stripping out all skill. It is a coin toss. If all things are equal, I would expect my team to win 41 games and lose 41 games per season and earn a total of 82 points out of a maximum 164 possible. We can calculate the variance of luck by plugging what we know into its formula below, where p is probability of winning (0.50) and n is the number of games played in a season (82):
var_of_luck = p * (1 - p) / n
var_of_luck = 0.5 * (1 - 0.5) / 82
var_of_luck = 0.003049
Now let's look at the variance of total NHL winning percentages for all teams for the 2025-26 season:
win_percentages = [.738, .689, .683, .665, .646, .646, .634, .610,
                   .604, .598, .598, .579, .579, .567, .561, .561,
                   .561, .561, .555, .549, .530, .524, .524, .524,
                   .512, .500, .482, .476, .470, .470, .439, .354]

np.var(win_percentages) = 0.006249
We can estimate the variance of skill by plugging these values into our original equation:
var_of_skill = 0.006249 - 0.003049
var_of_skill = 0.0032
Michael Mauboussin introduces this approach to thinking about luck and skill in sports in his book The Success Equation: Untangling Skill and Luck in Business, Sports, and Investing. Mauboussin uses True Score Theory to create a theoretical continuum ranging from 100% luck (and 0% skill) to 0% luck (and 100% skill). You can place any endeavor along this continuum by dividing the contribution of luck by the observed outcome. Following along with our example, the variance of luck divided by the variance of the observed outcome suggests that luck contributed 49% of the resulting standings for the 2025-26 season.
0.003049 / 0.006249 = 0.487918
This places hockey in the middle of Mauboussin's continuum:
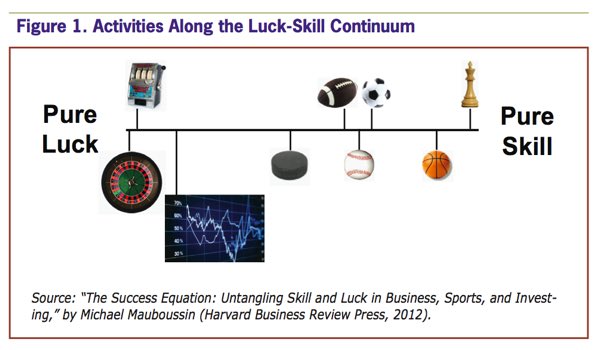
And our results are roughly in line with Mauboussin's 53% estimate for the five NHL seasons ending in 2012:
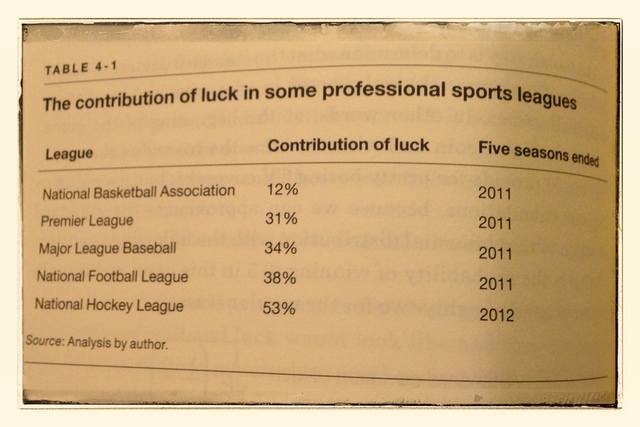
We determined that hockey is far more random than basketball just by looking at the parity in the NHL and relative lack thereof in the NBA over their respective 82-game seasons. There are several reasons why this holds true, but they all come back to one idea: individual skill is diluted in hockey far more than in basketball.
Start with playing time. The best basketball players log over 80% of each game. The best hockey players, with on-the-fly line changes cycling through eighteen skaters, typically play only 30–40%. That alone means each hockey game contains a smaller sample of any individual player's skill.
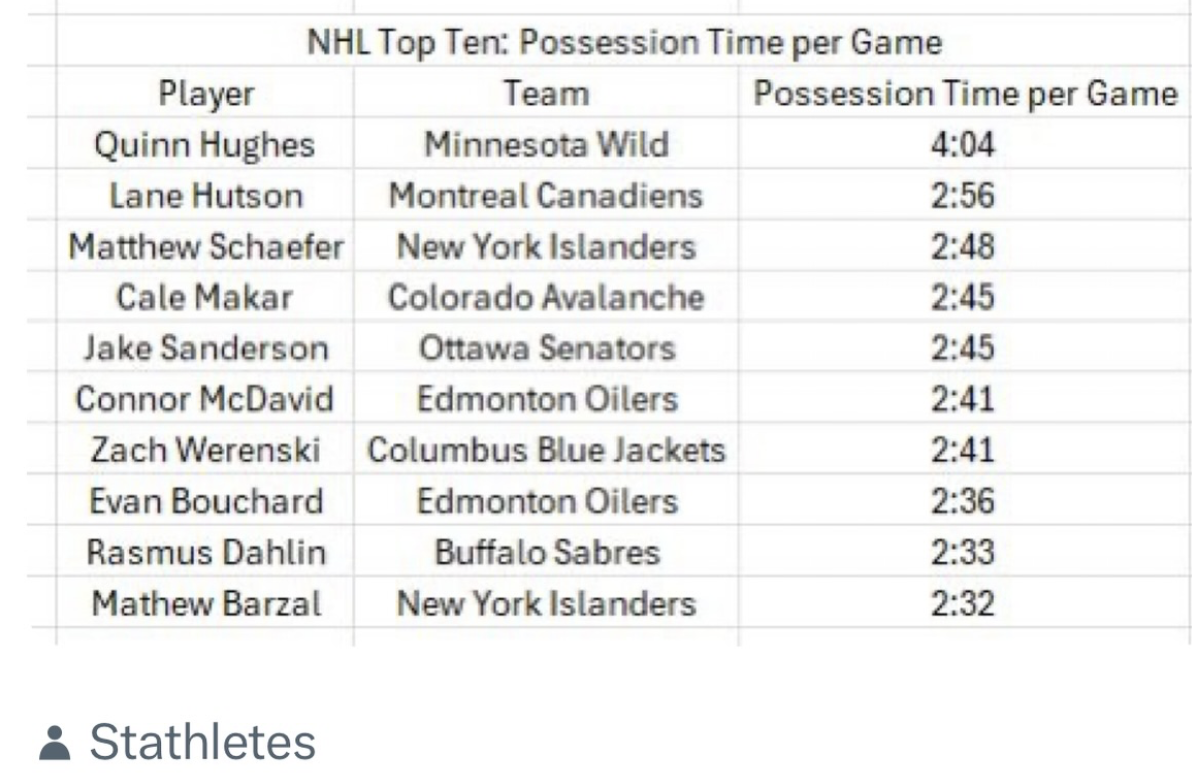
Then consider possession. NBA stars routinely post usage rates above 30% — they have the ball in their hands for a significant share of their team's possessions. In hockey, much of the game is spent with neither team in true possession. The most elite players in the world only control the puck for roughly 2–3 minutes per game.
The Hockey Gods May Giveth, But They Also Taketh Away...
Activities that involve significant amounts of luck will show a higher rate of reversion to the mean. Consider a predominantly skill-based activity like chess. If I go down 0–2 in a seven-match series against Magnus Carlsen, we can predict with confidence that I will lose the series — he is a Grandmaster and I can't even name all of the pieces on the board. Skill completely determines every match, so there is no mean reversion whatsoever.
Now consider something on the opposite end of the spectrum: picking the correct number at roulette (assuming I don't have Ed Thorp and Claude Shannon's wearable device telling me what to do). If I guess correctly on the first spin, my win rate is 100%. But since roulette is almost entirely luck, each subsequent spin will pull my win rate back toward the expected rate of 1/38.
These are the extremes. Most activities — hockey included — fall somewhere in between. Mauboussin introduces a useful concept for quantifying where: the shrinking factor.
expected_result = league_average + shrinking_factor x (observed_result - league_average)
A shrinking factor of 1 means the activity is all skill — there is no reversion, and the observed result is the best predictor of future performance. A shrinking factor of 0 means the activity is all luck — the best prediction for the next outcome is simply the base rate.
To illustrate: in baseball, the shrinking factor for batting average is approximately 0.20. If a player is hitting .350 early in the season, the expected year-end average would be .265 + 0.20 x (.350 - .265) = .282 — much closer to the league average than the hot start would suggest.
In hockey, where luck accounts for roughly half of observed outcomes, we should expect aggressive reversion. Montreal has made it this far largely thanks to a high shooting percentage in the first two rounds. Over a long enough horizon, that shooting percentage will almost certainly regress toward their long-term rate.
...Over Time
But here's what works in Montreal's favor: regression needs volume, and a seven-game series is a tiny sample. Montreal has played only 14 playoff games so far. With so few data points, variance runs high and unsustainable shooting percentages can persist just long enough to win a series. The Hurricanes dominate possession and throw pucks on the net at a high rate throughout the Brindamour era. They will likely continue to do so vs. Montreal, but if Dobes can absorb the volume and Montreal can convert on the chances they do get, the small sample may be all the cover they need to win the ECF.
Don't Be Fooled By Randomness
Nassim Taleb describes what he calls the Narrative Fallacy: our tendency, after observing an outcome, to construct a causal story that makes it feel inevitable. We are storytelling machines. Once something happens, we instinctively work backward to explain why it happened, as though no other outcome were ever possible.
Montreal's playoff run is a perfect case study. After two consecutive game-seven victories, the narratives write themselves: Newhook is clutch. Dobes is built for the postseason. This team has playoff DNA. These stories feel compelling precisely because the outcome already happened. But consider how thin the margins actually were — Montreal was outshot 29–9 against Tampa Bay and went nearly 27 minutes without a shot on goal. A puck bouncing differently off the post, a save not made, a whistle blown a second earlier, and the narrative flips entirely. Instead of "Montreal's magical run," it becomes "Montreal's inability to drive play finally caught up with them." Same team, same process, different story.
The outcome we observed is just one draw from a distribution of possible outcomes. In many parallel versions of that Tampa Bay series, Newhook isn't able to bat the puck out of mid-air, or he does but bats it into the side of the net or into Vasilevskiy's pads. Tampa scores on any one of their many chances and Montreal's season is over. The Narrative Fallacy tells us to ignore those alternative histories and treat what actually happened as if it were the only thing that could have happened.
This is especially dangerous in hockey, where randomness accounts for roughly half of observed outcomes. When we build narratives around results ("this player is a winner," "that team collapses under pressure"), we are often narrating noise.
Extracting Signal From Noisy Data
So if much of hockey is noise, how can we make sense out of any hockey data? As Albert Einstein noted, "Not everything that counts can be counted, and not everything that can be counted counts." Hockey generates an enormous amount of data (goals, assists, plus-minus, hits, blocked shots, time on ice) but just because a statistic exists doesn’t mean it tells us anything meaningful about a player’s skill. In a sport where randomness accounts for roughly half of observed outcomes, we need to be disciplined about which numbers we actually trust.
Mauboussin proposes two criteria for evaluating any performance metric:
-
Persistence (reliability): Does the statistic correlate with itself year over year? If a player ranks highly in a metric one season, do they tend to rank highly the next? High persistence suggests the metric is capturing something real and repeatable, skill rather than luck.
-
Predictability (validity): Does the statistic correlate with the outcome you actually care about? A metric can be highly persistent but ultimately irrelevant if it doesn’t help predict wins, goals, or other meaningful results.
The most useful statistics score highly on both dimensions. Drawing on research from David Berri and Martin Schmidt’s Stumbling on Wins, Mauboussin highlights how year-over-year correlations reveal which hockey statistics capture skill versus luck:
- Shots on goal per minute (r = 0.89): Very persistent. A player’s shot generation rate is largely a function of skill, playing style, and deployment.
- Shooting percentage (r = 0.63): Moderately persistent. There is a skill component, but a meaningful portion of the variance is attributable to luck.
- Plus-minus (r = 0.32): Weakly persistent. This is a stat heavily influenced by teammates, opponents, goaltending, and random bounces. Its low reliability makes it a poor indicator of individual skill.
A key insight emerges: the more a statistic depends on the interaction of teammates and opponents, the lower its year-over-year correlation tends to be. Plus-minus is a team-dependent outcome masquerading as an individual stat. Shooting percentage depends on shot quality, goaltender performance, and deflections. Shots per minute, by contrast, is more directly within a player’s control.
Consider Montreal again. Their high shooting percentage in the first two rounds is exactly the kind of stat the Narrative Fallacy latches onto. It looks like skill but carries a heavy dose of luck. A more process-driven metric, like expected goals based on shot quality and location, would give us a clearer picture of whether Montreal is genuinely creating quality chances or simply converting at an unsustainable rate.
This framework is what motivated the approach taken on this site. The HALO dataset provides a rich collection of AHL event data, and with it comes the temptation to treat every available statistic as meaningful. Using Mauboussin’s persistence and predictability tests, I plan to examine which metrics from this data actually capture repeatable skill and which are just noise. The goal is to identify the statistics that are both reliable sample to sample and predictive of the outcomes we care about, and to build player evaluations on that foundation.
How to Win the Stanley Cup
Mauboussin concludes that when success is probabilistic, the link between cause and effect is broken. He writes, "In the short term, even when you do everything right, the outcome of your effort can be bad. Moreover, you can succeed even when you do everything wrong" (pg. 167). The goal is still to win the Stanley Cup, not just to be right about who should have won. But understanding randomness helps you build the kind of team that wins more often. In domains with high luck, it is valuable to pay attention to the underlying process as well as the observed outcomes. We see this every year when the previous Cup winner's strategy becomes the league's flavor of the summer, whether it was Washington's top-heavy star power in 2018 or Tampa Bay's cap-circumventing depth in 2020 and 2021. Rather than copying what worked once, it is more important to discover process-driven metrics that are both reliable and valid in an attempt to strip away some of the randomness that contaminates traditional stats.
To win the Cup, a team must win 16 of a possible maximum 28 games. We need to understand that 28 games is a very small sample size for a random sport like hockey. We should expect some surprises to happen in such a small sample. A President's Trophy winner could easily get knocked out for a variety of reasons: a hot opposing goaltender, a couple of bad breaks in close games, poor finishing luck, or injuries to key players. Your organization's best chance of winning a Stanley Cup is to build a core group of players approaching their peak seasons (say ages 25-32) before older age or accumulated injuries begin to take a toll. You almost never see these players make it to unrestricted free agency, so you need to either draft these players or manage your farm system so that you have the assets to acquire an elite player when one becomes available. Once you have this core, your window is open. Over a period of 6-8 years, you must do the work to provide your core with complementary players that will complete your team. With some luck, all of the cards fall the right way.
The HALO dataset gives us millions of rows of raw material to work with. In future posts, I will try to evaluate players at the AHL level using the persistence and predictability framework outlined above. If we can identify which metrics reliably capture repeatable skill in the minors, maybe we can provide value by better identifying winning players and strategies.